Pygraph is a freely available, lightweight and easy to use visualization client for viewing 1D data files. The idea of Pygraph was suggested by the need for an alternative to the software ygraph which is not developed anymore. Therefore, Pygraph is a Python reimplementation of ygraph.
Pygraph has been developed in Python (version 2.x) and the graphical interface was built with PyQt4, the Python binding library of the famous Qt4 framework, and PyQwt, the binding of the Qwt library. Pygraph also uses other libraries such as texttables and scidata. See the README released with the sources for further details.
Pygraph inherits most of the features of ygraph, in addition to many others, such as
Pygraph is developed and mantained by two people
Pygraph is hosted on bitbucket at https://bitbucket.org/dradice/pygraph. It can be installed with a simple command line instruction; please make sure you also install all required dependencies.
PyQt reference: Summerfield - "Rapid GUI Programming with Python and Qt"
Logo: Giulio Colombo - giulio.colombo.1994 [[ at ]] gmail.com
OS-X users can install Pygraph and all its dependencies with the following package
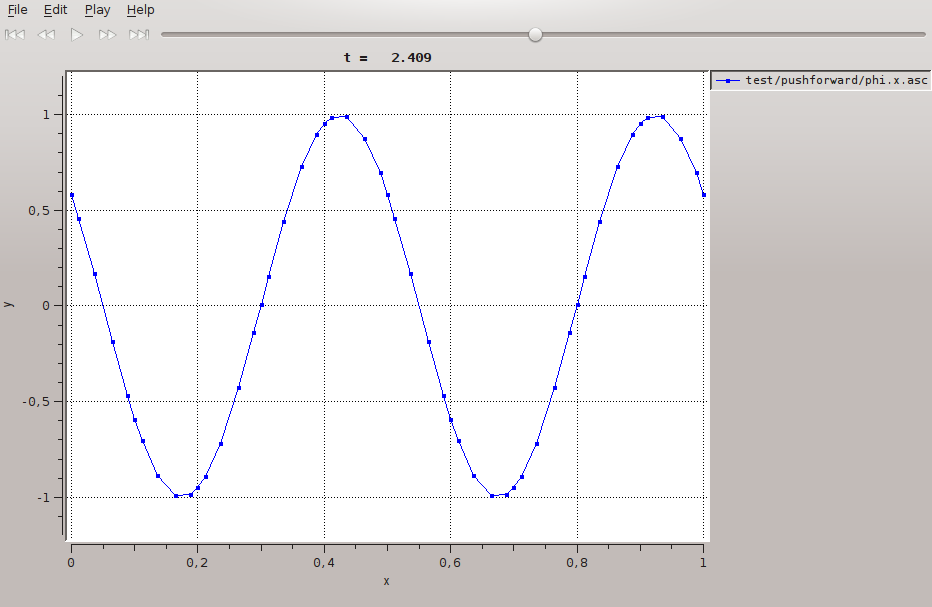
Pygraph plotting a simple sine function.
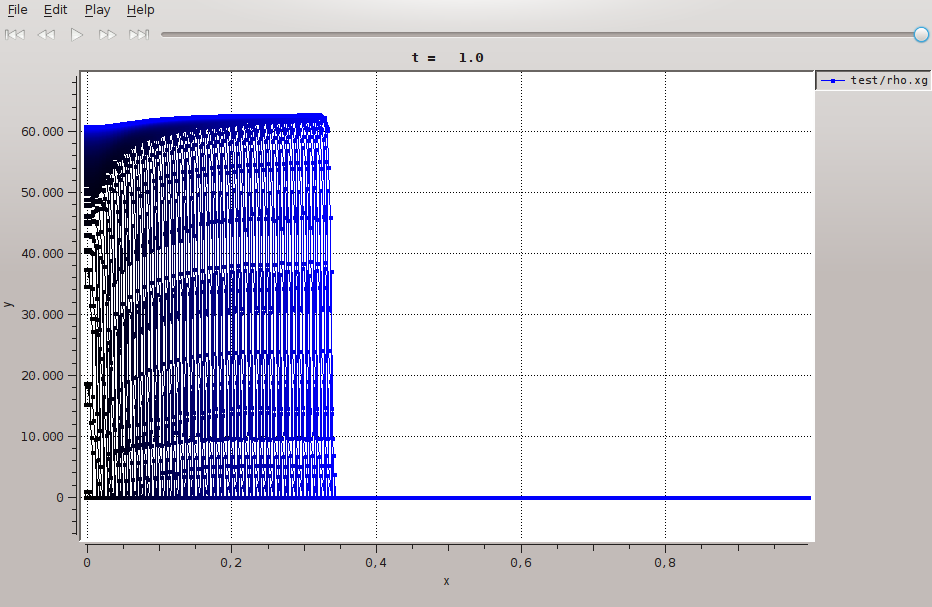
The "Show all" function for a wave propagation. The lines color fade from black [first frame] to blue [last frame].